Synopsis
I think that the public discourse on the economy is overly negative and skewed to the downside. As Philipp Carlsson-Szlezak puts it:
“Doomsayers often pull longshot risks from the edges of the risk distribution and present them as base cases.”
Despite recent volatility, the U.S. economy has shown resilience with output in 2024 surpassing pre-COVID predictions for 2020. However, I want to present both sides in this post. I will attempt to straw-man the risks to the economy first (“Bear Case”) before outlining my “Bull Case” below. This will help you decide which case is more compelling.
If you found this helpful, please share it with your friends - it really helps me out!
Bear Case
Presidential Election Uncertainty

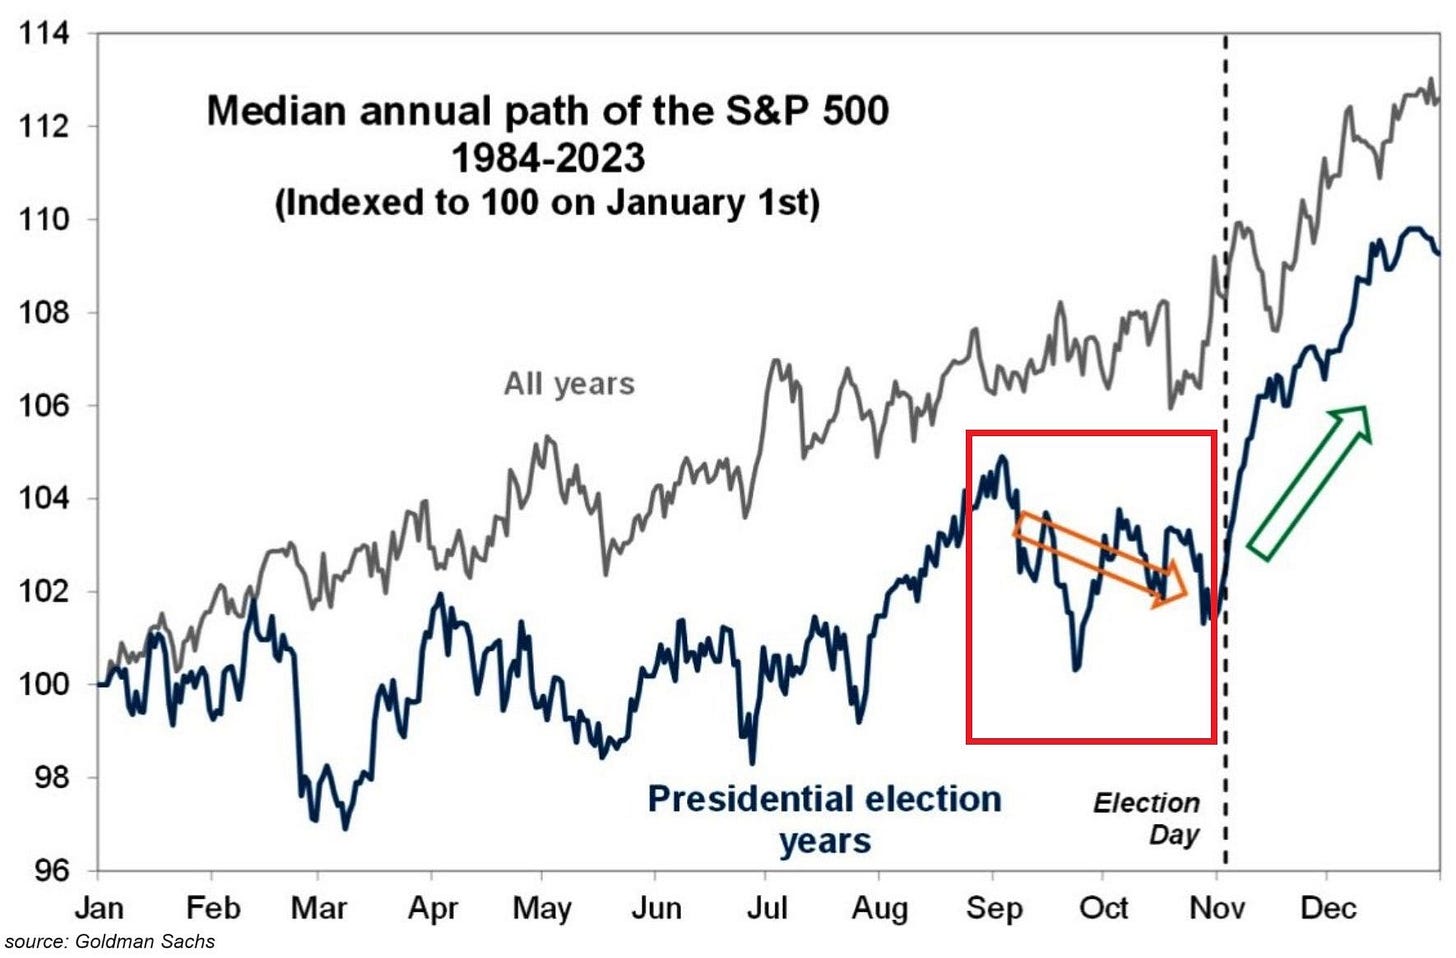
Seasonal patterns, election year dynamics, and economic uncertainty is creating a perfect storm for market volatility in September 2024.
The upcoming Trump-Harris debate is amplifying market volatility. Investors are particularly focused on potential policy divergences in taxation and trade. (“Trump-Harris Debate: Stocks, Bonds, Currencies to Watch”)
A Republican sweep would all but guarantee an extension of individual tax cuts set to end in 2025. There would likely be more aggressive use of tariffs
A Democratic sweep would likely result in increasing spending on fiscal stimulus and social programs, higher taxes on corporates, funds, and HNW individuals, and potentially stricter regulations
On taxes, Goldman Sachs estimates that Trump's proposed corporate tax rate cut to 15% from the current 21% could boost S&P 500 earnings by approximately 4%. In contrast, Harris' plan to increase the corporate tax rate to 28% could potentially reduce S&P 500 profits by about 8%, according to Goldman Sachs.
On trade policy, Trump has proposed a 10% across-the-board tariff, with even steeper penalties on Chinese-made goods. Harris' messaging suggests a firm stance on China without escalating tensions between the world's two largest economies.
Presidential election years tend to see market peaks around Labor Day, followed by declines through the election.
The Volatility Index (VIX) has seen an avg. spike of ~10% in September over the last 33 years.
Active managers like hedge funds may continue selling U.S. stocks ahead of the November election (Barnert et al.)
Nvidia's dramatic stock movements highlight the concentration risk in markets heavily weighted towards a few large tech companies.
Nvidia's decline contributed to a $2.2 trillion market cap erasure for the S&P 500 in the first week of September.
Nvidia's market cap fell $279 billion in a single day last week, the largest single-day decline for any company in history. This drop was larger than the market cap of 474 companies in the S&P 500.
Bank of Japan Rate Hike Prospects / Yen Carry Trade Unwind
The Bank of Japan is expected to hike rates by the end of 2024. This, coupled with potential rate cuts in the US (100bps by year end) might cause currency volatility and a further unwind Yen carry trades.
Tomoko Amaya, a former senior official at Japan's Financial Services Agency, suggests that the Bank of Japan (BOJ) may hike rates again by the end of 2024. Amaya notes that the pace of rate hikes is considered more important than the level itself for banks' concerns.
Most BOJ watchers anticipate a rate hike by January, provided there's no return to the market instability seen in early August.
Labor Market Cooling

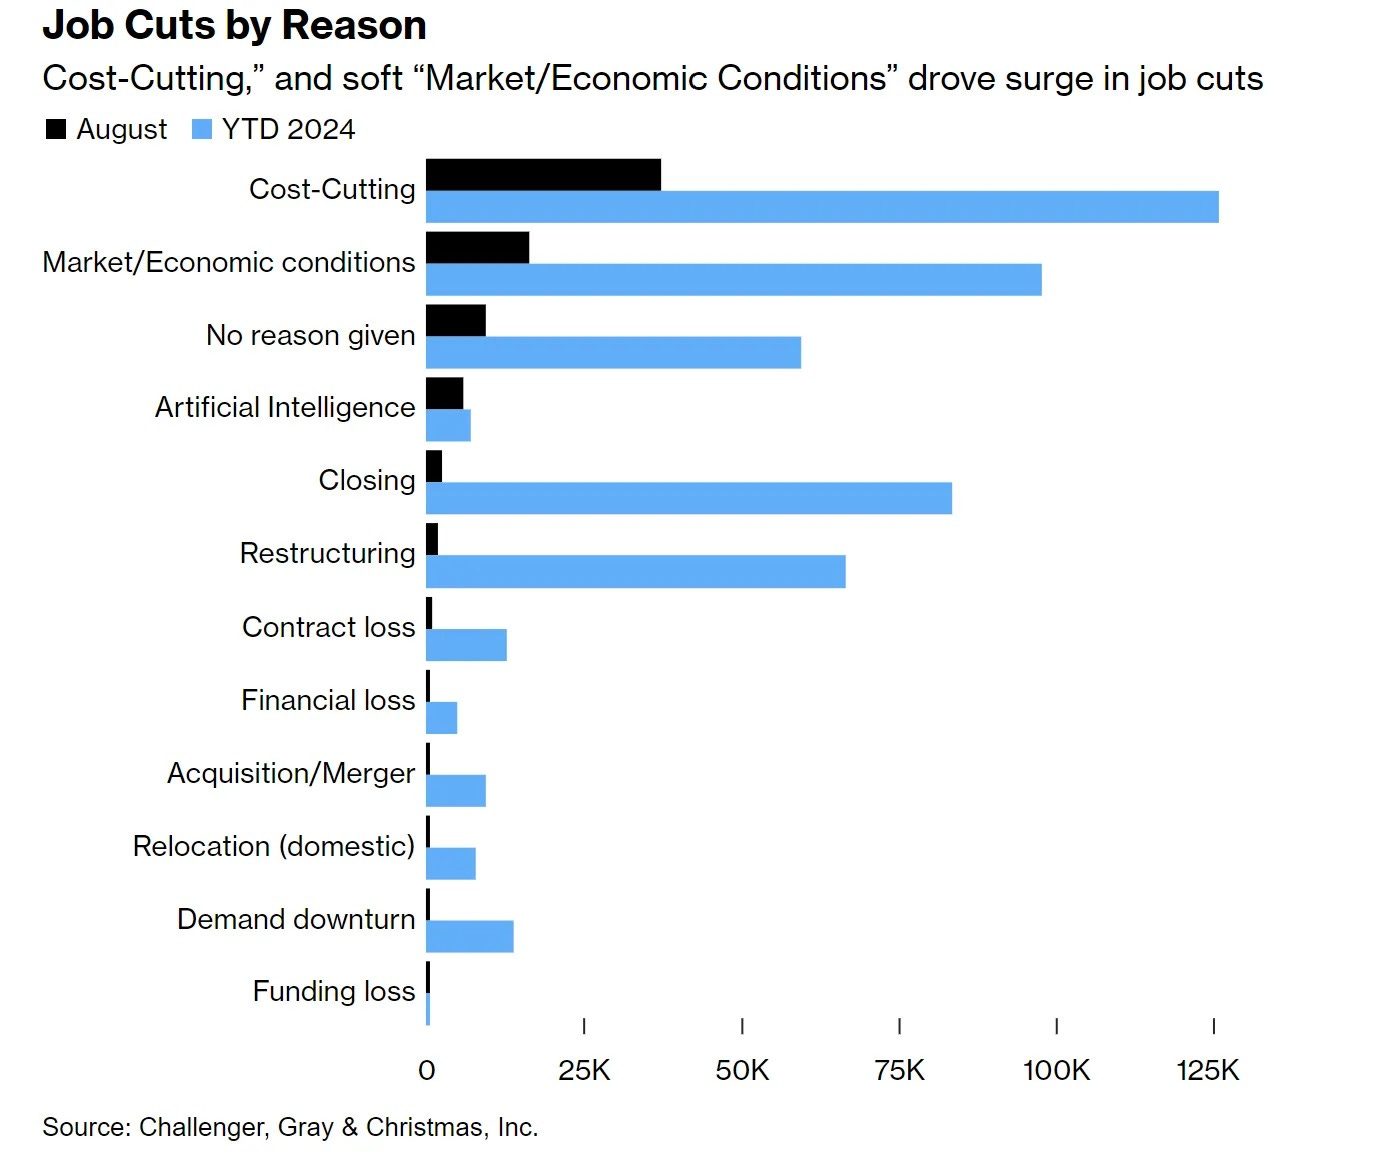
The US labor market is showing clear signs of cooling, with declining job openings, slowing payroll growth, and widespread increases in unemployment rates. This could have implications for consumer spending and overall economic growth in the coming months.
U.S. economy added 142,000 jobs in August 2024, below expectations of 161,000. August private payrolls rose by only 99,000, the smallest gain since 2021. Furthermore, July's job gain was revised down to 89,000, the lowest level since December 2020.
Non-farm payrolls are weakening, with the 3-year average barely above 200k. Historically, when the 3-year average of non-farm payrolls drops below 100k, it has been a leading indicator of recession.
The unemployment rate decreased to 4.2% from 4.3%. This is the first decline in five months. 90% of US cities saw a rise in year-over-year unemployment rates in July.
Job openings dropped to 7.67 million in July, the lowest level since January 2021. The ratio of job vacancies to unemployed workers fell to 1.07 in July, in line with 2018 levels.
Average weekly wages dropped in 43% of 389 metropolitan areas. Monthly payroll gains 30% weaker than previously reported.
Weak Manufacturing
The persistent contraction in US manufacturing, coupled with rising input prices, presents a challenging scenario of potential stagflation.
US manufacturing activity remained in contraction territory in August, with the ISM manufacturing PMI index at 47.2 points.
Manufacturing activity has now shrunk in 21 of the last 22 months, extending the second-longest downturn in history.
The prices paid index jumped to 54.0 points from 52.9 in July, expanding for the 8th month in a row.
Rail traffic volumes are slightly below pre-pandemic levels, indicating some manufacturing weakness.
Rising fiscal deficits are unsustainable
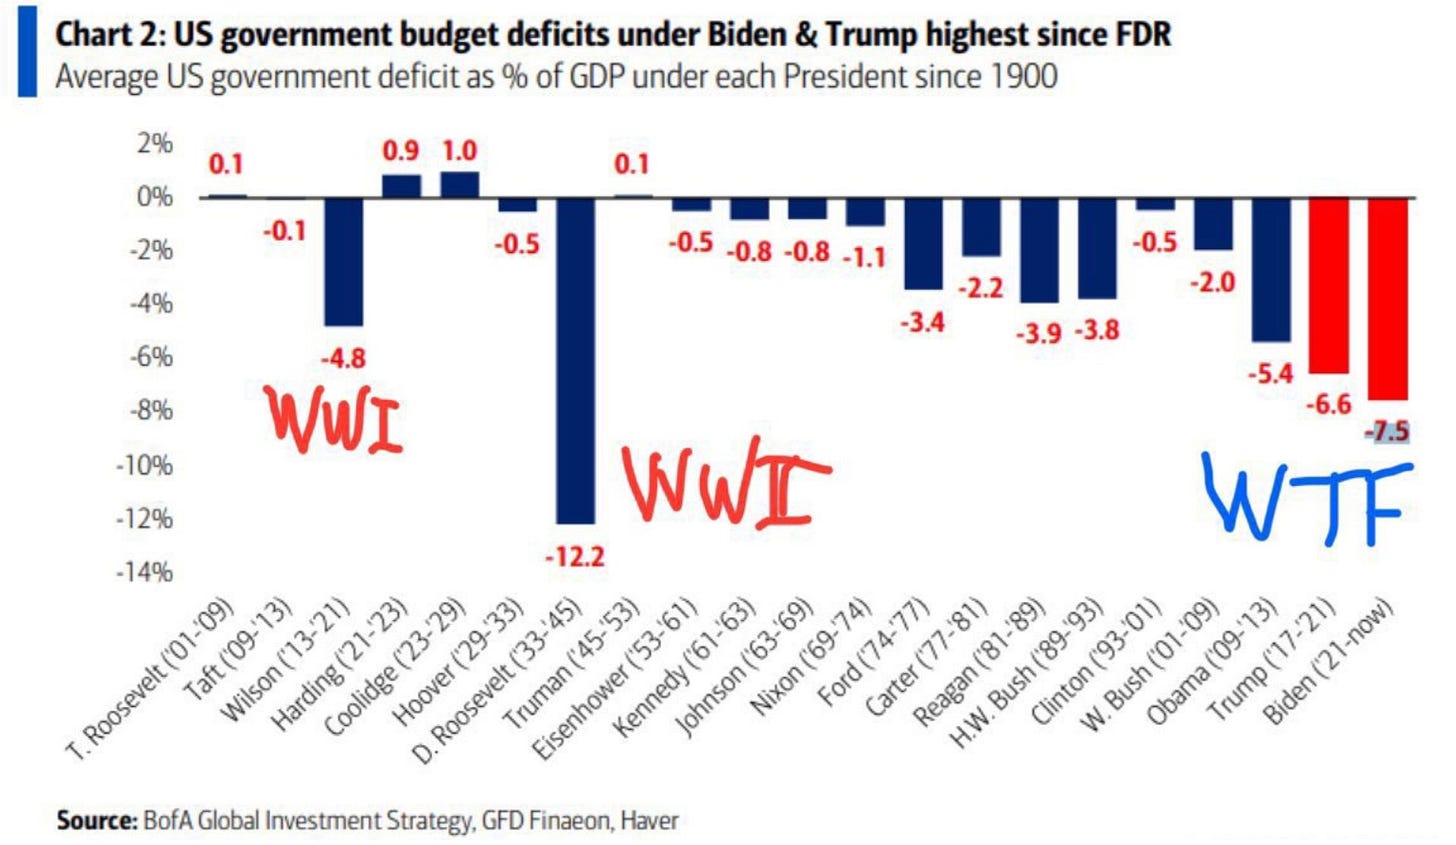
The rapid increase in US government debt and associated interest payments represents a growing fiscal challenge. This could limit the government's ability to respond to future economic crises.
U.S. federal deficits are running at about 6% of GDP
The US is now paying $3 billion in debt interest per day, up from $1 billion before COVID and $2 billion during COVID.
US debt increased by $64 billion in one day to start September, reaching a record high of $35.3 trillion.
Large deficits may make it more difficult to bring CPI down to the 2% target.
We have created a situation where both rate hikes and cuts may have less impact than it did historically. Fiscal policy may be a more significant factor in driving economic outcomes in the near term.
Fiscal dominance may lead to sub-par economic outcomes where nominal growth can persist alongside real economic struggles. This means that rate cuts may be ineffective at stimulating the economy
While some sectors like commercial real estate and small businesses have been impacted by higher interest rates, most other sectors have handled it fine.
U.S. homeowners have more fixed-rate debt compared to other countries
Corporations locked in long-duration fixed-rate debt
Federal government debt has an average duration of about 6 years
Bankruptcy filings are increasing
The rapid increase in debt across the corporate sector has caused some companies to seek bankruptcy protection (credit to
)The number of bankruptcy filings hit 452 year-to-date, (2nd largest in 13 years).
In August 63 companies went bankrupt (the 4th largest month since the Covid crisis)
Bull Case
Growth is slowing, but not enough to signal recession
Corporate earnings show remarkable resilience, extending beyond top performers indicating broad-based strength. Strong earnings may provide a buffer against potential downturn risk.
The growth in corporate profits (+8% YoY) suggests continued expansion
S&P 500 Q2 2024 EPS is up 11.4% YoY, the fourth consecutive growth quarter.
S&P 500 ex-Magnificent 7 earnings growth is up 6.5% YoY in Q2 2024.
79% of S&P 500 companies reported positive EPS surprises in Q2 2024.
S&P 500 Q2 2024 blended net profit margin is 12.2%
This is above last year’s net profit margin (11.6%); above the 5-year average (11.5%); and above the previous quarter’s margin (11.8%).
High-frequency data indicates a growing economy with few signs of weakness or slowdown. Consumer spending, travel, and labor markets all show continued strength
Robust consumer spending, particularly in services, indicates ongoing economic vitality.
Weekly retail sales are up 5-6% year-over-year
The savings rate fell to 2.9% and spending outpaced income growth in 10 out of the last 12 months.
Daily debit card spending is up 2-3% year-over-year across most retail sectors
Restaurant bookings are strong, with seated diners up significantly compared to 2019 levels
Inflation is declining

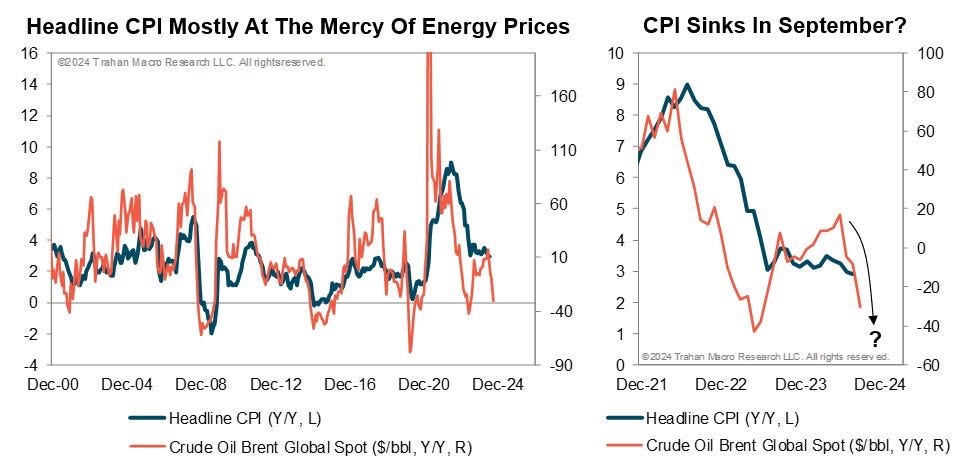
Core PCE has declined to +2.6% YoY; CPI will likely surprise to the downside in September due to declining energy prices
The bond market may be underpricing inflation risks (shelter CPI still > 5%). However, inflation re-acceleation likely won’t be a factor until next year.
Labor incomes are strong due to labor hoarding
Despite some moderation, the labor market remains strong, supported by the labor hoarding phenomenon (incomes are growing).
Tight labor market
The private sector layoffs and discharges rate remains low at 1.2%, despite other softening indicators in the labor market.
Wage growth
Wages accelerated in August, > 4% YoY, particularly at the bottom of the distribution
Incremental productivity gains
Productivity is inflecting upward due to immigration (net new labor). The working age immigrant population has increased to nearly 40 million, up from 36 million pre-pandemic
Faster diffusion of technology like AI is also helping (incentivizes firms to embrace technology and move to the technological frontier)


