

The Historic Rotation Out of US Assets
What I am watching to know when it's time to re-deploy cash into the market

TL;DR
The S&P 500 is off to one of the worst starts in the last 70 years in 2025, confirming the significant shift in investor sentiment against US equities. This is largely due to a massive rotation out of US assets. The scale and velocity of this rotation, coupled with the systematic unwinding of US dollar positions by central banks globally represents the reversal of a decades-long financialization cycle that favored US assets.
This correction differs from past episodes because it's driven by a structural shift in both trade policy and global capital flows. The simultaneous weakness in the dollar (hit a three-year low), US equities, and US treasuries is evidence of this shift.
"In risk-off periods over the past 20-30 years, the dollar has been rising because it's always been a shelter. I haven't seen that here because the risk premium applied to all US assets is on the rise and it's the end of US exceptionalism."
— Societe Generale's head of asset allocation Alain Bokobza
Bokobza, who correctly predicted the end of US market exceptionalism in September 2024, maintains that global investors' rotation out of American assets will continue for years if President Trump persists with his current trade policy. Since Bokobza's February warning, the S&P 500 has fallen 15% while the Dollar Index is down 9%.
In my March 11, 2025 post, I warned subscribers to raise cash (ended up being the right call). I am not smart enough to figure out what market scenario might materialize next, but I plan to wait for a market confirmation before deploying my cash back into the equity market. If you want to see the technical and fundamental indicators I am watching to assess a re-entry point in the market scroll down to the “Portfolio Positioning” section.
The problem
Triple Threat: The combined impact of federal workforce reductions, tariffs, and immigration declines is creating constraints on both supply and demand.
The Federal Reserve Bank of Atlanta's projection of 1.2 million job losses from federal workforce reductions alone would represent a significant economic drag that cannot be quickly offset by domestic manufacturing gains.
The Penn Wharton Budget Model projects that "Trump's tariffs (April 8, 2025) would reduce GDP by about 8% and wages by 7%," with a middle-income household facing a "$58K lifetime loss." These projected losses are "twice as large as a revenue-equivalent corporate tax increase from 21% to 36%."
Balance-of-Payments Reality: The financial dominance of the US is being challenged on multiple fronts: the dollar and Treasury bonds are losing appeal, and US equities have underperformed global peers this year. As Julien Brigden notes, this follows simple double-entry accounting: smaller trade deficits mathematically mean smaller capital surpluses.
Corporate Retrenchment: Hiring announcements by U.S. employers last year were the lowest since 2015, while planned job cuts totaled 761,358, the highest since 2020 when the labor market was hit by the COVID-19 pandemic. Companies facing tariff-induced uncertainty may continue to cut capital expenditures and headcount to appease shareholders, amplifying economic contraction.
Futhermore, the Federal Reserve is between a rock and a hard place with respect to rate cuts. Former New York Fed President Bill Dudley identifies a few critical constraints in his Bloomberg Opinion piece:
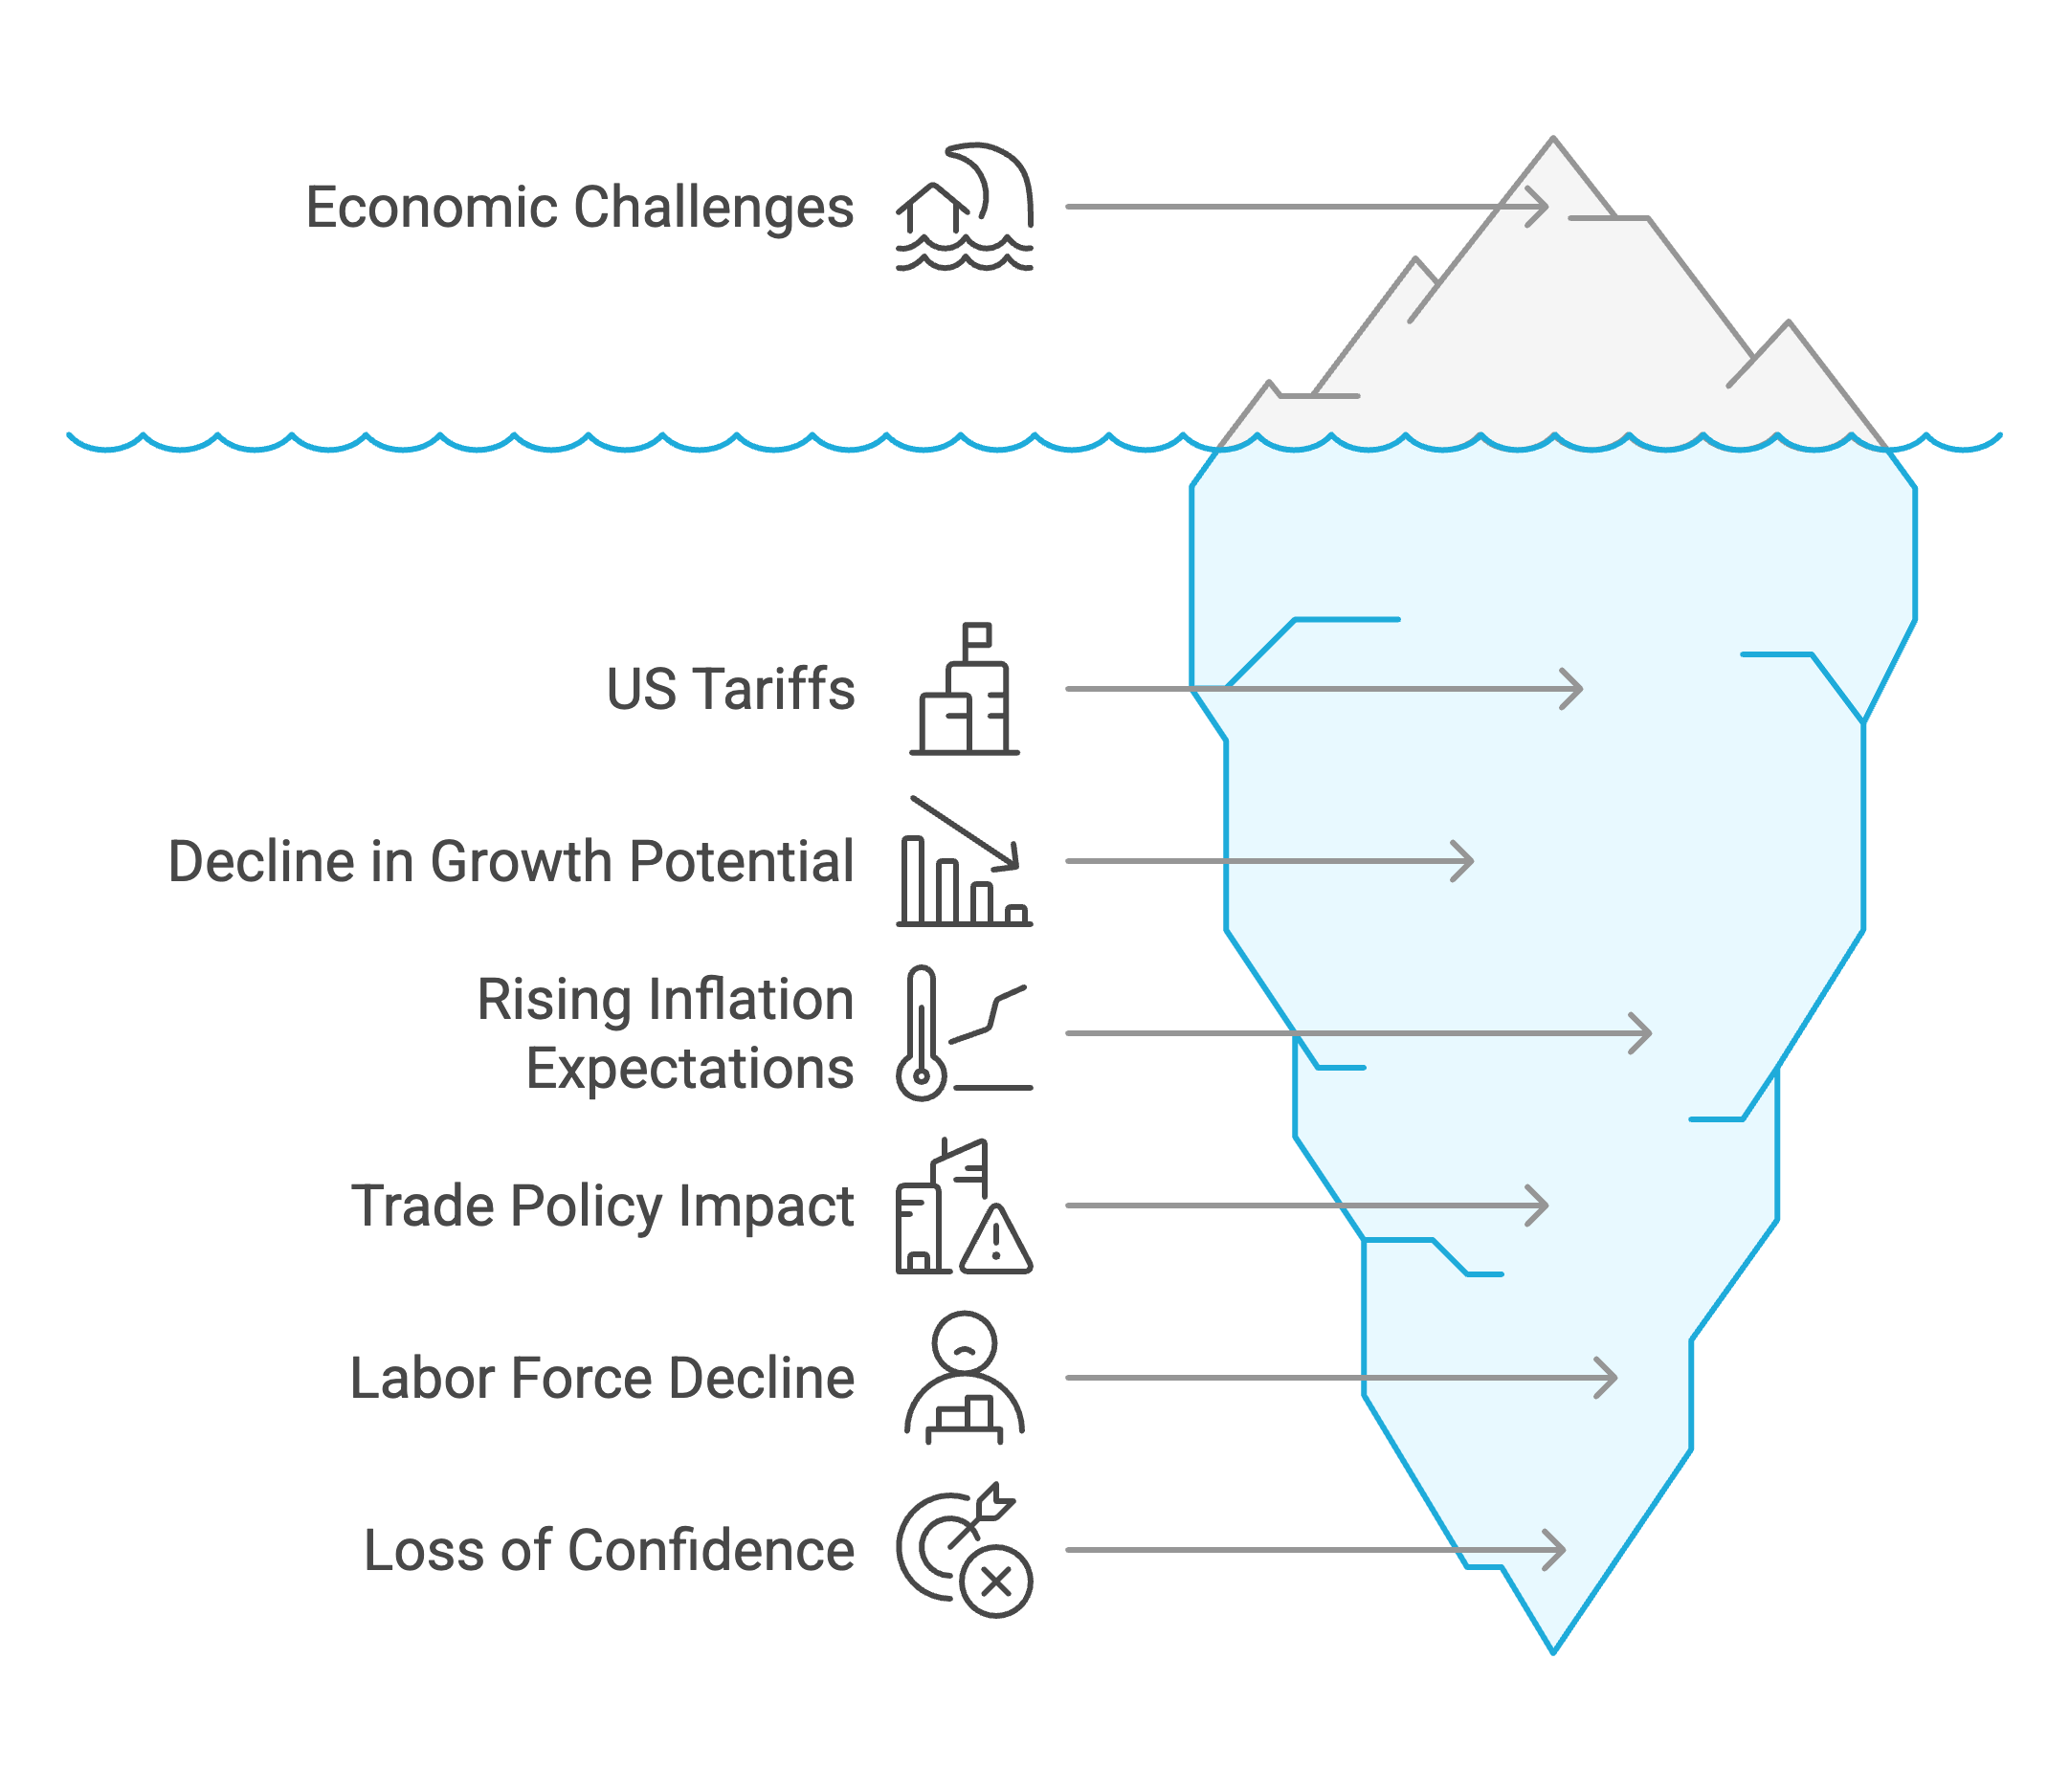
US tariffs that have been far larger than Fed officials anticipated. The economic outlook is unusually cloudy due to these policy changes.
US growth potential has fallen abruptly and sharply. The shift in trade policy will undermine productivity growth. The large decline in labor force growth will also constrain economic activity. The collapse in border apprehensions implies a near cessation of immigration into the US. Labor supply will also be restrained by much higher rates of deportations.
Inflation expectations have risen substantially. If Fed officials were to cut rates and this was interpreted as caving to the White House pressure, confidence in the Fed's ability to contain inflation would diminish, pushing up inflation expectations.
Portfolio Positioning
In my March 11, 2025 post, I warned to pivot to cash (got it right, but perhaps not entirely for the right reasons). I am still largely in cash (short term treasuries) today.
Here are two scenarios that I could see playing out:
The "Art of the Deal" Works (Temporarily): Major countries negotiate seemingly favorable deals with the US over the next 60-90 days. For example, Treasury Secretary Scott Bessent said that while trade negotiations with Beijing will likely be "a slog," he believes there will be a de-escalation of U.S.-China trade tensions. This relatively positive news is seen as a victory, and markets recover (risk-on)
The “Revenge of the Creditors”: Foreign countries hold a massive amount ($8.5 trillion, or 30%) of US Treasury debt. Furthermore, at least $6-9 trillion of debt needs to be refinanced this year. Simultaneous selling of Treasuries from foreign creditors (in response to the trade war) could drive up yields, causing dislocation in the bond market (risk-off).
I am not going to “buy dips” but instead wait for market confirmation before deploying my cash position back into the equity market. Here are a few indicators I am watching closely:
Technical
Bottoming Pattern Formation: The S&P 500 establishing a clear bottoming pattern (double bottom, inverse head and shoulders). The market reacts to bad news but ends up closing higher on the day for multiple sessions.
Volume Confirmation: Significantly higher trading volume on up days versus down days, indicating institutional commitment. There have been some positive signs recently but these are not evidence of a trend yet.
Breadth Improvement: The advance-decline line turning positive, showing market gains are broad-based rather than concentrated in a few sectors. This needs to be sustained for multiple periods (on higher volume)
Fundamental
Capital Flow Reversal: Evidence that foreign selling of US assets has exhausted itself. The Treasury International Capital (TIC) data might give us hints on the direction of travel here (The next release, which will report on data for March 2025, is scheduled for May 16, 2025)
Credit Market Health: High-yield bond spreads narrowing from their widened state, indicating reduced corporate stress. High-yield (junk) bond spreads have widened sharply in early April, peaking at around 4.61% on April 7, up from below 2.7% in February. Since then, spreads have narrowed slightly to 4.16% (April 16th). If this trend downward continues I view that as a positive signal.