Weekly Macro Update: Sept 4th, 2024
Market volatility ahead? Tech sector stumbles; market rotation to defensives; focus on upcoming employment releases later this week
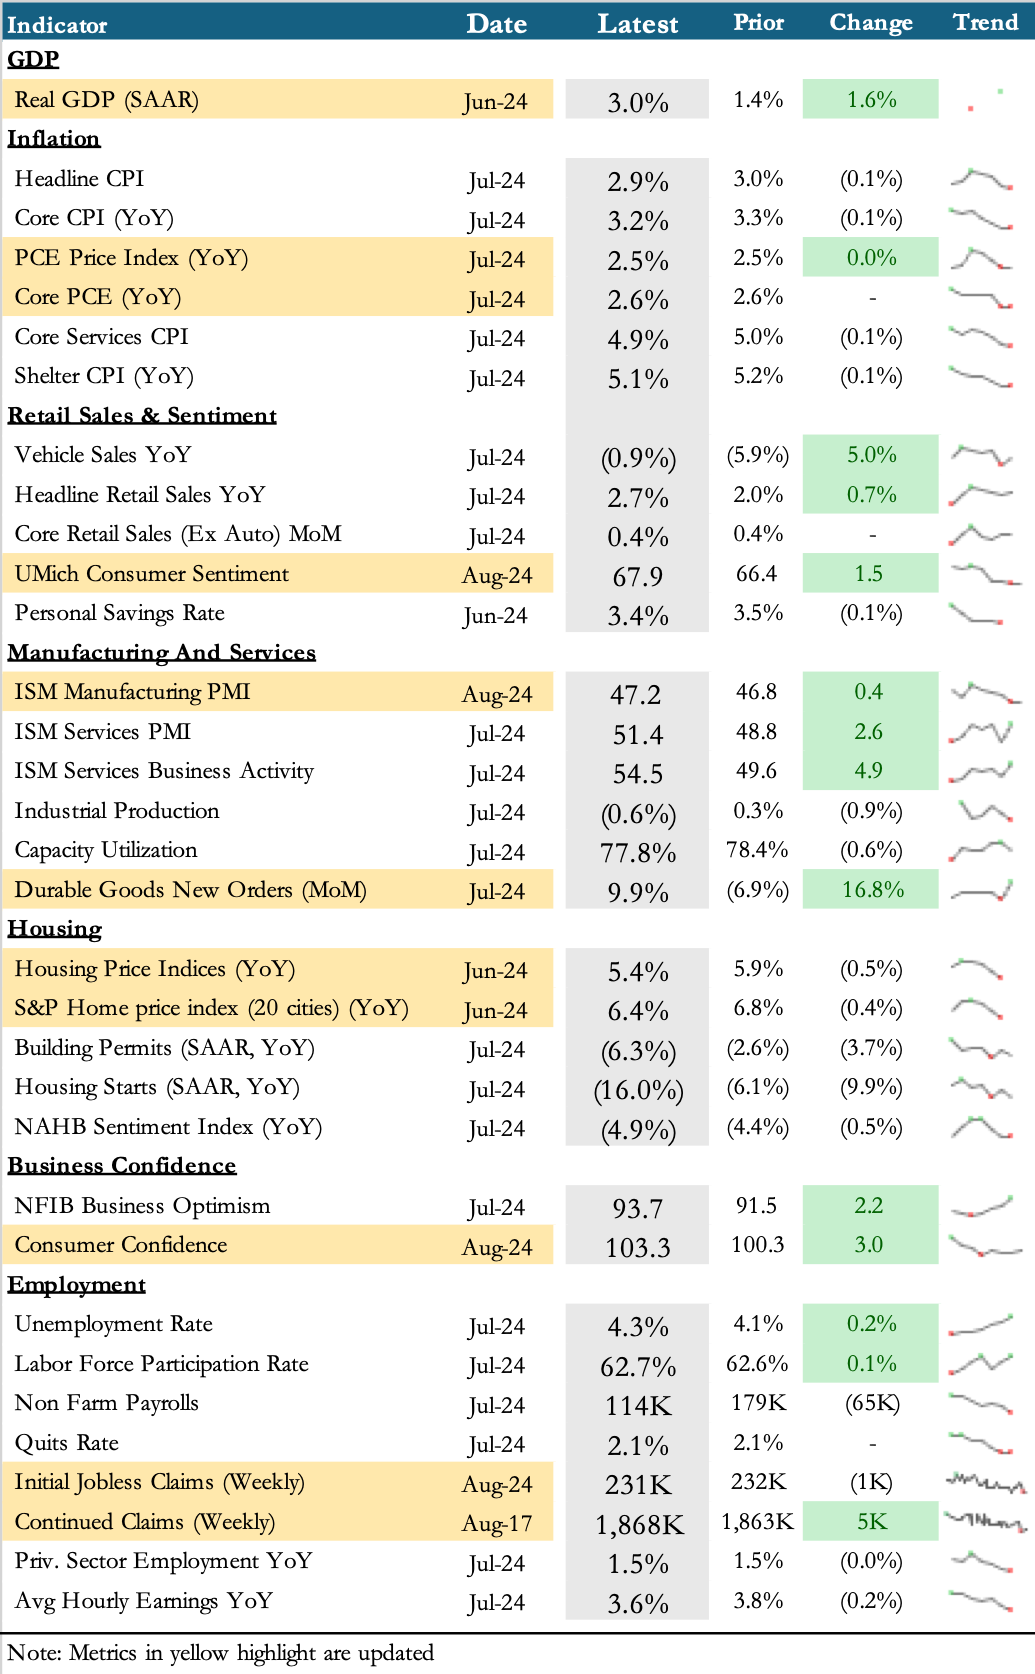
Macro Scorecard
If you found this helpful, please share it with your friends - it really helps me out!
Stock Market Update
The S&P 500 experienced its worst day yesterday since August 5th, with the tech sector leading the decline. A rotation into cyclical and defensive stocks (represented above in the light blue) may occur as Nvidia (hit with a subpoena) and the remaining Mag7 names struggle.
At 21x earnings, the S&P 500 is trading near the top decile of its historical valuation range. This valuation assumes 11% EPS growth, compared to the long-term average of 7%. Any disappointing economic data, particularly in the upcoming August jobs report, could increase market volatility due to uncertainty about Federal Reserve interest rate decisions.
While September has historically been challenging for stocks, it has been positive in 62.5% of presidential election years (15 out of 24 instances since 1928).
What Happened This Past Week?
Wednesday, September 4th: JOLTS job report
Job openings relatively stable at 7.7M (-1.1M YoY). The job openings rate held steady at 4.6%. June was revised down by 274K to 7.9M.
Hires were flat at 5.5M (3.5% rate). Total separations increased to 5.4M (+336K), but quits and layoffs were flat at 3.3M (2.1% rate) and 1.8M (1.1% rate), respectively.
Takeaway: The July JOLTS report indicates a labor market that remains resilient but showing signs of gradual cooling, with job openings holding steady at 7.7M despite a year-over-year decline. While hiring and quit rates remain relatively stable, the increase in total separations suggests employers may be struggling with employee turnover.
Tuesday, September 3rd: Manufacturing PMI
ISM Manufacturing PMI: 47.2% (vs. 46.8% prev). This is the 5th consecutive month of contraction (readings below 50)
Takeaway: The manufacturing sector continues to struggle, with the PMI suggesting widespread contraction. However, given that manufacturing's contribution to GDP is relatively low (10.3% in 2023), the primary concern is that this weakness may be reflected in upcoming employment data. Key indicators to watch include ADP employment figures, initial jobless claims, and the unemployment rate, all of which are scheduled for release this week.
Friday, August 30th: Inflation, spending, and consumer sentiment
Inflation moderating
PCE index (YoY): +2.5% YoY
Core PCE (YoY): +2.6% YoY
Personal income: +0.30% MoM in July (vs. +0.20% fcst and prev)
Personal spending: +0.50% MoM in July (vs. +0.50% fcst; +0.30% prev)
Chicago PMI: 46.10 in August (vs. 45.60 fcst; 45.30 prev)
Consumer sentiment (final): 67.90% in August (vs. 68.00% fcst; 67.80% prev)

Takeaway: U.S. inflation continues to moderate, with Core PCE at +2.6% year-over-year. However, shelter inflation remains elevated at 5.1% year-over-year, contributing approximately 25% to the July 2024 PCE reading. The recent increase in housing prices (up +6.50%) may pose additional inflation risks. On the consumer front, spending growth is outpacing income growth which raises questions about sustainability of that trend. However, this may not be an immediate concern, as credit card delinquencies remain historically low (3.25% in Q2 2024 compared to the 2009 peak of 6.8%).
Thursday, August 29th: GDP revision, jobless claims, and home sales
The BEA revised the Q2 2024 GDP growth rate up to 3% (vs. +2.80% fcst and prev)
The economy’s main growth engine — personal spending — advanced 2.9%, versus the prior estimate of 2.3%.
Gross Domestic Income (GDI), an alternative measure of economic activity, rose by a more moderate 1.3% in Q2, matching the first-quarter gain
Initial jobless claims: 231K for week ending Aug 24 (vs. 230K fcst; 233K prev)
Pending home sales: -5.5% in July (vs. +0.10% fcst; +4.80% prev)
Takeaway: The U.S. economy demonstrated stronger-than-anticipated growth in the second quarter of 2024, primarily driven by resilient consumer spending (2.9% YoY). The revised GDP figure (3% vs. +2.80% prev) suggests that the U.S. economy is maintaining momentum despite predictions of a slowdown. However, all eyes are on the jobs numbers now as they will determine the Fed’s rate cut strategy.
Tuesday, August 27th: Home prices and consumer confidence
S&P Case-Shiller home price index (20 major cities)
+6.50% in June (vs. +6.30% fcst; +6.90% prev)
Consumer confidence is higher in August
103.3 in August (vs. 101 fcst; 100.3 prev)
Takeaway: The Case-Shiller Home Price Index, which tracks the purchase prices of single-family homes, is up 51% over the last 4 years (up 5.4% this year - all time high). This shows that the housing market is strong despite higher rates while consumer sentiment remains robust, potentially supporting continued spending.
Monday, August 26th: Durable Goods Orders
Overall durable goods orders increased 9.9% MoM in July (up 1.4% YoY)
Takeaway: Excluding transportation, durable goods orders remained relatively flat. While specific sectors like commercial aircraft are rebounding from recent lows, broader business spending is sanguine at best. This caution may stem from economic uncertainties and the upcoming presidential election.
Sentiment
Bullish sentiment among individual investors has increased in recent weeks, rising from 40.5% in early August to 51.2% by August 28th, 2024
The NAAIM Exposure Index, with its most recent reading at 81.34, indicates that active managers are maintaining a relatively high exposure to US equity markets
The AAII Sentiment Survey offers insight into the opinions of individual investors
The NAAIM Exposure Index represents the average exposure to US Equity markets
Economic Releases This Week
Wednesday, Sept. 4
U.S. trade deficit, Job openings, Factory orders, Auto sales
Thursday, Sept. 5
ADP employment, Initial jobless claims, U.S. productivity (revision), S&P final U.S. services PMI, ISM services
Friday, Sept. 6
U.S. employment report, U.S. unemployment rate, U.S. hourly wages


