Overview
Why the S&P 500 is Near Record Highs Despite Unlikely Fed Rate Cuts
The S&P still has room to go higher. Several factors are contributing to the market's resilience:
Valuations: They are high but not at extreme levels. The S&P 500 has a forward P/E ratio above 21x (vs. 30-year average of 16.6x). While elevated compared to history, valuation has limited predictive power for near-term returns (JP Morgan - Guide to the Markets, 2024).
Shifting Stock Composition: Rate-sensitive companies are drifting out of the S&P 500 index while tech stocks are pulling forward earnings. Leverage ratios are also lower compared to past cycles (Subramanian, 2024).
Corporate Margins: Companies have demonstrated surprising resilience to inflation and cost pressures, maintaining pricing power.
Market Sentiment: Sentiment is positive but not at euphoric extremes, indicating potential upside.
Analyst Recommendations: The BofA sell-side indicator shows analysts recommending a 55% allocation to equities (vs. typical 60% benchmark weighting) (Subramanian, 2024).
Pension Fund Exposure: Average US pension fund exposure to public equities is at the lowest level since the late 1990s (Subramanian, 2024).
This isn’t the full story. As mentioned in my first post, success in markets hinges on accurately predicting changes in fundamental factors (growth, inflation, fiscal policy, and monetary policy) which drive prices over the medium and long term.
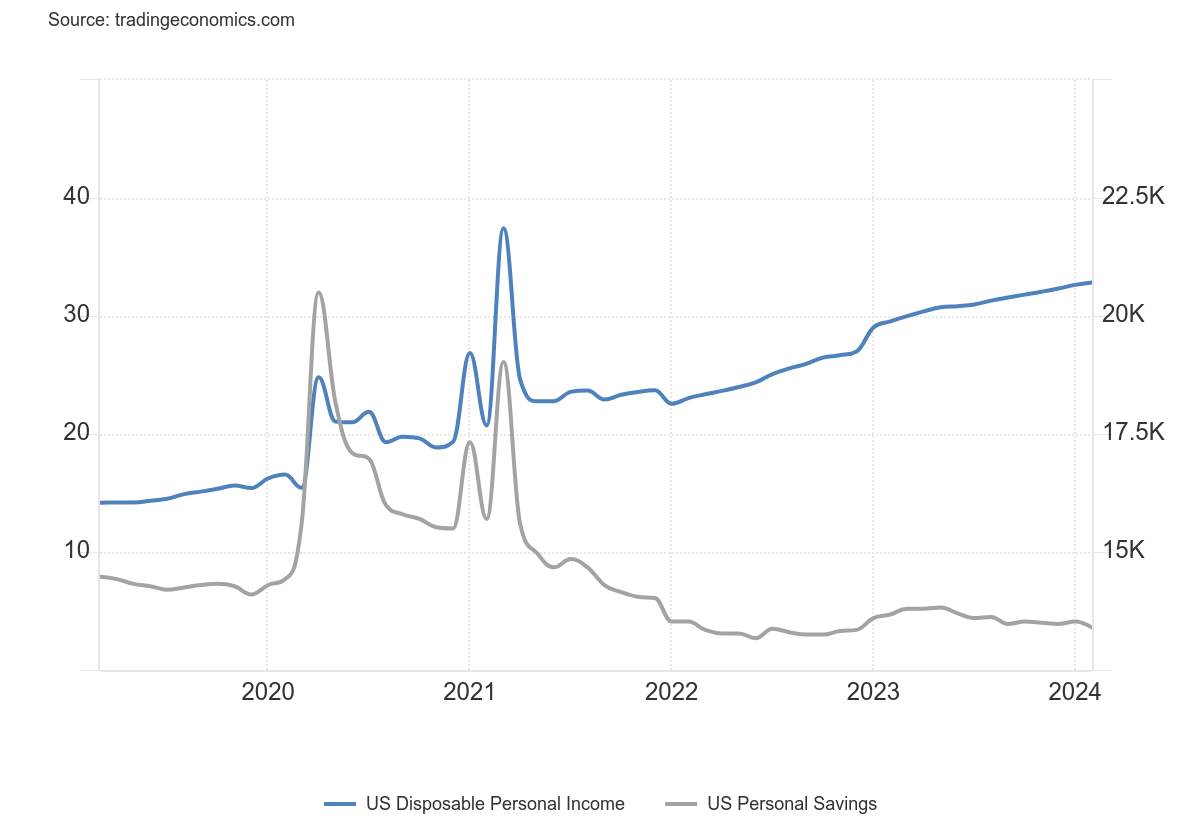
Growth: Global growth remains positive and may be accelerating in the US. Incomes are expanding while savings rates plummet, indicating a stronger consumer spending more on goods and services.
Inflation: Inflationary pressures appear to be moderating in the US services sector while increasing in the manufacturing sector. Shelter inflation, a major contributor to inflation growth this year, may start to moderate over the next six months if lower home prices are reflected in headline figures.
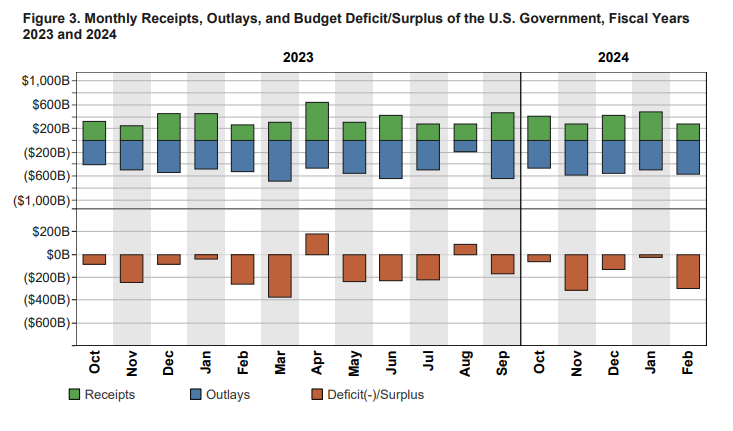
Fiscal Policy: Soaring U.S. government debt is on an unsustainable trajectory across various interest rate scenarios (Sakthivel et al., 2024). However, fiscal support is unlikely to moderate in an election year.
Monetary Policy: Bond traders are pricing in less monetary policy easing by the Fed in 2024 following strong U.S. economic data releases (Mackenzie, 2024).
I have crafted a visual story of those core drivers (full of charts, statistics, and simple takeaways) below. Let’s get started!
1. Growth
Global Composite PMIs
This chart is a visual representation of global economic activity over time, measured by the Purchasing Managers' Index (PMI) for different regions and countries. The PMI is a crucial bellwether of economic activity. A reading above 50 indicates expansion, while below 50 signals contraction.
As you can see, the chart is mostly in green territory indicating growth. The data shows that the global economy continues to expand, albeit at a more moderate pace compared to last year. The services sector remains a bright spot, and manufacturing has started to expand (in the US, India, and China) while remaining tepid abroad.
United States
Key Takeaways and Trends:
• The US economy is showing signs of resilience, with both manufacturing and services sectors expanding, albeit at a slower pace in services.
• Labor market conditions are improving in the US manufacturing sector, which may help ease production constraints and support the ongoing expansion.
Manufacturing PMI Insights:
• The US manufacturing sector, as measured by the ISM Headline, is expanding at its fastest pace since September 2022, with a reading of 50.3. This suggests a rebound in US manufacturing activity.
• US manufacturing employment (ISM Employment at 47.4) is improving, reaching a 3-month high, which may help alleviate labor shortages and support production.
• The number of US industries reporting overall growth (8) is at its highest since September 2022, suggesting a broadening of the manufacturing expansion.
Services PMI Insights:
• The US services sector is showing mixed signals, with the ISM Services Headline decelerating to a 3-month low of 51.4, while the ISM Services Employment accelerates to a 2-month high of 48.5.
• The ISM Services New Orders-Backlog Spread (9.6) is accelerating, reaching a 7-month high, indicating stronger demand and potential future growth in the services sector.
Rest of World (ROW) Insights
Key Takeaways and Trends:
The global economy is experiencing an uneven recovery, with some countries and sectors outperforming others. India and China are emerging as bright spots, with strong growth in both manufacturing and services sectors, likely to support global growth prospects. Meanwhile Europe is facing a mixed picture, with some countries experiencing accelerating growth while others decelerate, highlighting the need for targeted policies to support the recovery.
Manufacturing PMI Insights:
• Global manufacturing activity shows mixed trends, with some countries expanding [Canada 49.8, India 59.1, UK, Italy 50.1] while others are in contraction territory [Spain (51.4), France (46.2), Germany (41.9), Eurozone (46.1), and Australia 47.3].
Services PMI Insights:
• The global services sector is generally showing signs of improvement. Japan (51.7), China (52.7 for both official and Caixin), Australia (55.3), India (61.8), Spain (55.3), Italy (53.5), France (48.3), Germany (47.7), and the Eurozone (50.3) are all seeing an acceleration in their services sectors, with many reaching multi-month highs. This suggests a broadening recovery in global services activity.
• Some economies (UK, Canada) are experiencing a deceleration in services activity. Canada (47.0) and the UK (52.8) both reached multi-month lows, indicating potential headwinds in these economies.
Income and Savings Rates (USA)

Incomes are expanding while savings rates are plummeting. The two measures have decoupled showing that US consumers are spending more as their incomes are rising. This strength is likely to be sustained because household debt levels relative to GDP are still at historic lows (~73% of GDP in Q3 2023 vs. ~79% of GDP in 2021)
USA Disposable Personal Income (Blue Line - RHS axis): US disposable income rose to $20.7B in Feb-24 (0.3% MoM). Incomes have been steadily increasing.
US Personal Savings Rate (Gray Line - LHS axis): US household saving rate dropped to 3.6% in February 2024 from 4.1% in January. This is also a historic low (avg. ~8.5% historically from 1959 - 2024; all-time high of ~32% in April 2020)
Job Growth vs. Unemployment Rate (USA)
The U.S. labor market remains a key pillar of economic resilience, with robust job growth and slightly higher wage growth in the March employment report. The unemployment rate went down to 3.8% despite strong job additions, signaling a resilient labor force.
Non-farm Payrolls (Blue Bars - RHS axis): US added 303K jobs in March 2024, surpassing the forecast of 214K. This broad-based job growth across multiple sectors indicates continued labor market strength and demand for workers.
Historical figures were revised (Jan-24 is 256K; +27K) (Feb-24 is 270K; -5K). With these revisions, employment in January and February combined is 22K higher than previously reported.
Notable job gains occurred in health care (+72K), government (+71K), construction (+39K), and leisure and hospitality (+49K). Construction job growth doubled compared to the prior 12-month average.
Unemployment Rate (Gray Line - LHS axis): The unemployment rate was little changed at 3.8% and has remained between 3.7% and 3.9% since August 2023.
Slightly higher wage growth this month with slightly longer work weeks.
Average hourly earnings increased to 4.1% from a year earlier, the smallest annual advance since mid-2021 (Golle & Stirling, 2024).
The average workweek for all private nonfarm payroll employees edged up 0.1 hour to 34.4 hours (U.S. Bureau of Labor Statistics, 2024).
2. Inflation
Inflation has been a persistent challenge, prompting central banks to aggressively hike interest rates. However, there are signs that price pressures may be peaking.
Core inflation is in positive territory but could decline as shelter disinflation starts to appear in the numbers (shelter inflation lags by 12 mo.)
Core inflation ex-food & energy (red line) readings were 3.8% in Feb-24 vs. 5.6% peak in Mar-23. The trend is lower so far.
Shelter inflation (purple line) could come down in the coming months. Shelter inflation declined to 5.7% in Feb-24 (vs. peak of 8.2% in Mar-23). The slowdown in shelter inflation (evidenced by lower MoM readings in S&P Corelogic Case-Shiller Index) should bring overall inflation down (the largest contributor to CPI growth historically; reversal could mean declining inflation)
Inflationary pressures appear to be moderating in the US services sector, while increasing in the manufacturing sector.
US services inflation pressures are easing. The ISM Services Prices fell to 53.4, the lowest reading since March 2020.
US manufacturing inflation is accelerating. ISM Prices (55.8) and ISM New Orders (51.4) in the US are also accelerating, reaching multi-month highs, indicating increasing demand and potential inflationary pressures.
3. Fiscal Policy
The U.S. has entered an era of structural fiscal dominance, characterized by fiscal spending that consistently exceeds receipts (chart above). The U.S. budget deficit was ~$1.7 trillion U.S. dollars in 2023, which was around 6.3% of U.S. GDP. The long-term sustainability of running large fiscal deficits remains a concern, but we don’t expect the trend to reverse anytime soon (particularly in an election year).
Soaring U.S. government debt is raising alarms among policymakers and business leaders. Furthermore, Bloomberg Economics simulations are pointing to an unsustainable trajectory for fiscal spending across various interest rate scenarios (Sakthivel et al., 2024).
U.S. debt-to-GDP ratio: In 88% of 1 million simulations run by Bloomberg Economics, the U.S. debt-to-GDP ratio is found to be on an unsustainable path over the next decade. Using market pricing for interest rates, the analysis shows debt-to-GDP hitting 123% by 2034, pushing debt servicing costs to worrying heights (Sakthivel et al., 2024).
BlackRock CEO Larry Fink said the U.S. fiscal situation is "more urgent than I can ever remember".
4. Monetary Policy
Fed Target Rate Probabilities for the Dec-2024 Meeting

Fed Chair Jerome Powell has taken recent inflation data in stride, while Governor Christopher Waller suggested it may be necessary to hold rates higher for longer (Mackenzie, 2024). Bond traders are pricing in less monetary policy easing by the Federal Reserve in 2024 (rate cut probabilities here) following strong U.S. economic data releases (Mackenzie, 2024).
Bibliography:
Golle, V., & Stirling, C. (2024, March 31). US Payrolls Seen Hitting at Least 200,000 for a Fourth Month. Bloomberg.
Greifeld, K. (2024, April 1). Citadel's Ken Griffin Sees 'Modest' Growth, Warns on US Debt. Bloomberg.
J.P. Morgan Asset Management [Kelly, D.P., Jackson, J.K., Manley, J.C., Pandit, M., Santos, G.D., Aliaga, S., Gauba, S., Vyas, N., Park Durham, M., & Hall, B.] (2024). Guide to the Markets
Mackenzie, M. (2024, April 1). June Fed Rate-Cut Odds Dip Below 50% After Strong ISM Data. Bloomberg.
Sakthivel, B., Cousin, M., & Wilcox, D. (2024, April 1). A Million Simulations, One Verdict for US Economy: Debt Danger Ahead. Bloomberg.
Subramanian, S. (2024, April). Why Savita Subramanian Thinks Stocks Can Keep Going Higher. Odd Lots Podcast.


