Stocks resilient on earnings beats/inflation
79% earnings beats; inflation below 3%; liquidity back after yen carry trade unwind
TL;DR
S&P 500 maintains uptrend despite correction: 69% of stocks are above their 200-day moving average, while 79% of reporting companies beat earnings estimates
Growth in corporate earnings surpass projections: 79% of 455 reporting companies beat estimates by an average of 4%, with 12% YoY growth vs. 9% consensus est.
Inflation (CPI) below 3%, but shelter costs ticking up: overall inflation is moderating (CPI +2.9% YoY and Core CPI +3.2% YoY); however shelter inflation is rising at a faster pace (+0.4% MoM vs. 0.2% MoM in June)
Valuation metrics suggest fair pricing: S&P 500 trades at 21.4x forward P/E, while MegaCap stocks trade at 27.6x (down from 30.0x on July 26th)
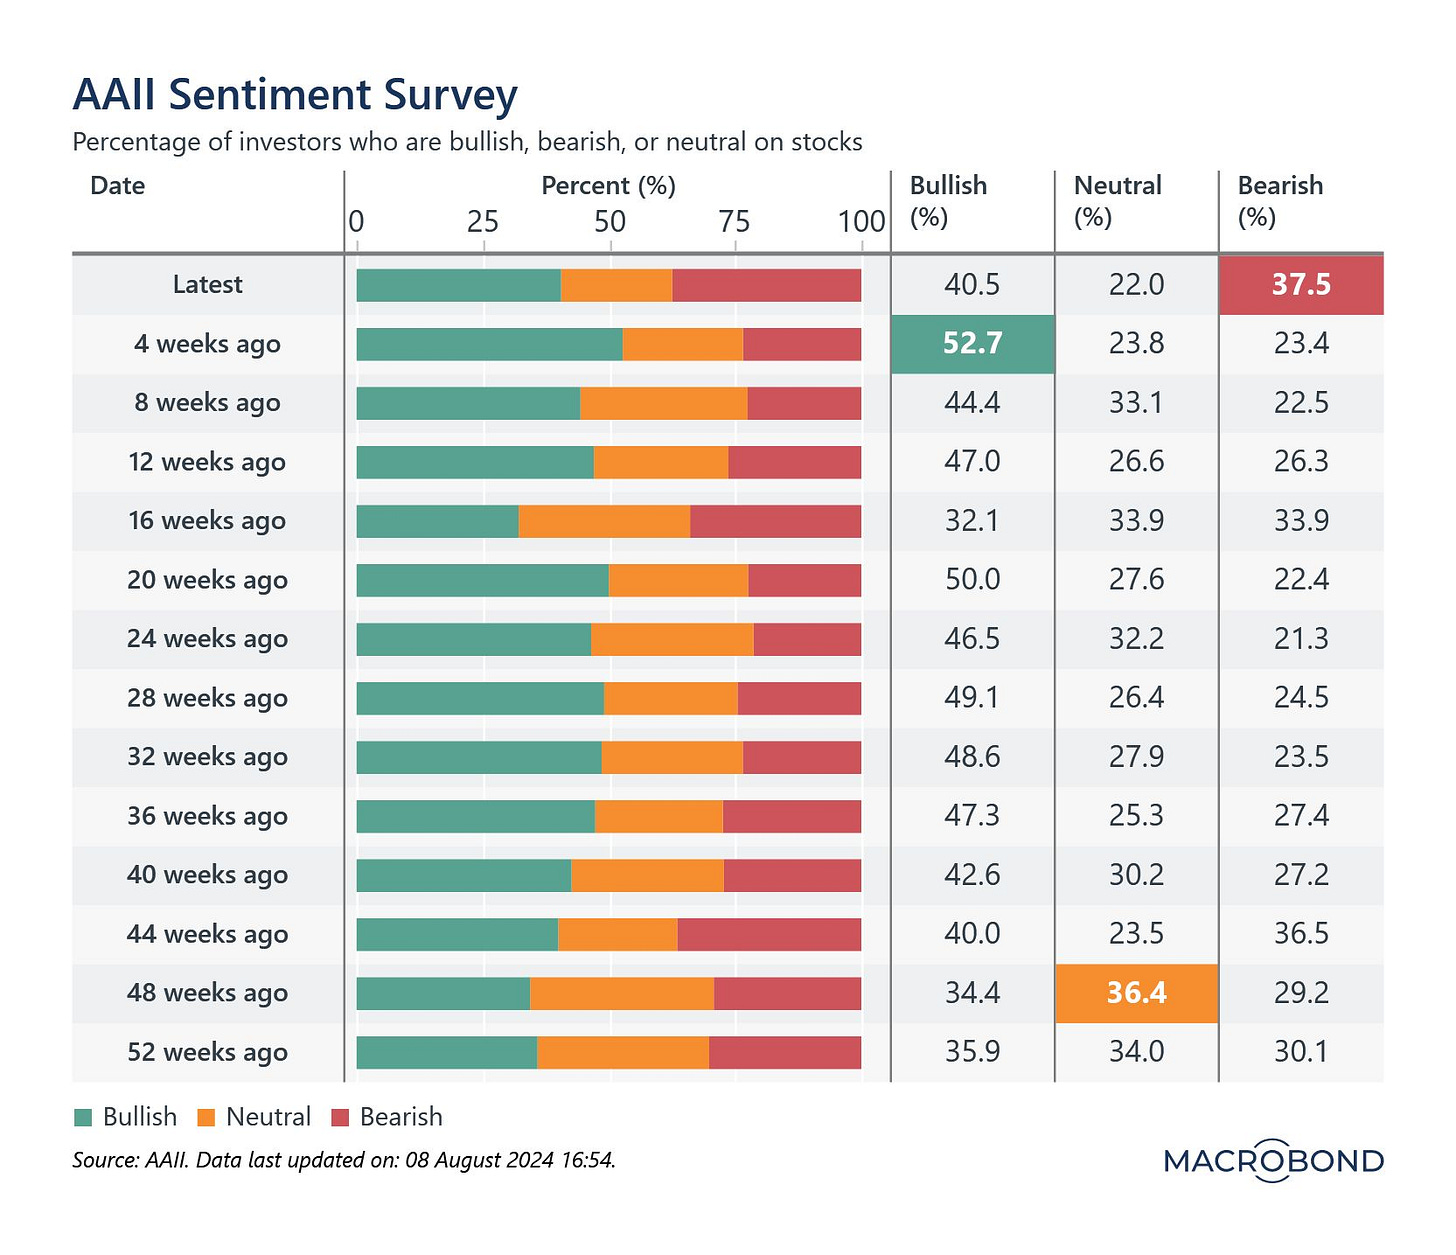
Investor sentiment turns bearish: AAII survey shows 37.45% bearish sentiment (up from 23.4% four weeks ago), with a record 3.3 million S&P 500 Put Options traded on Monday. This shift may present a buying opportunity for those confident in the economy's fundamentals.
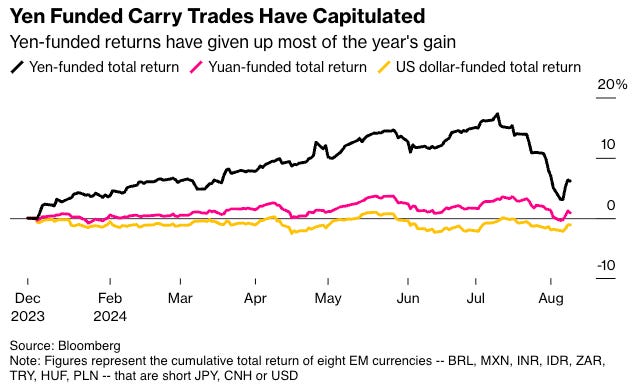
Yen carry trade unwinding: JP Morgan estimates 75% of the $4 trillion trade has been unwound this week, potentially boosting global liquidity. TS Lombard analysts suggest approximately $1.1 trillion remains to be unwound.
My views only; not financial advice - see disclaimer below
Market Update
The U.S. stock market remains in a bull market, despite recent volatility and corrections. Valuations seem reasonable as well.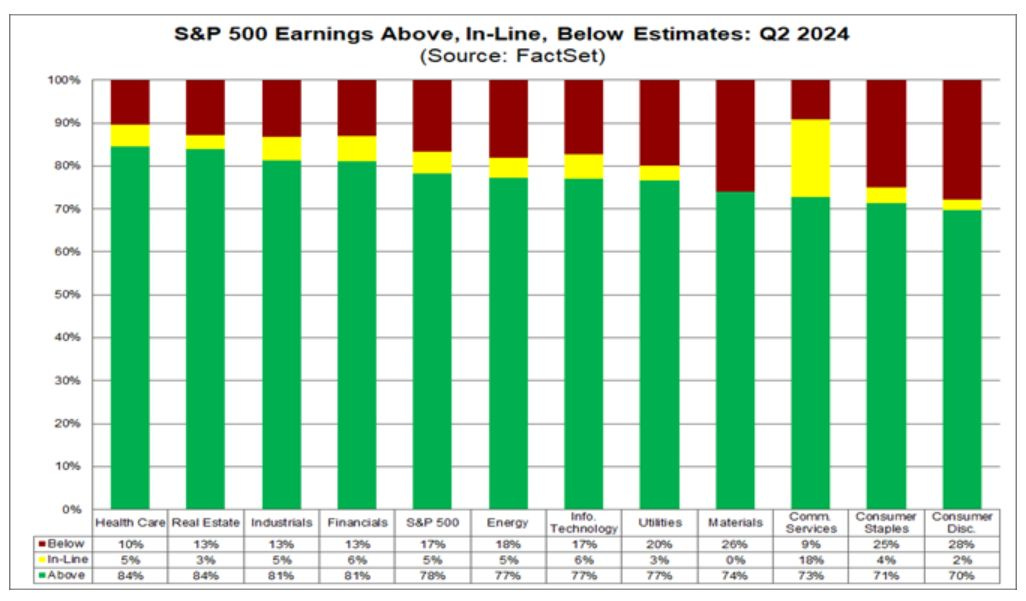
Corporate earnings are growing and accelerating
S&P 500 forward profit margins near record high levels (Apollo). Earnings up 12% year-over-year versus consensus expectation of 9% (Syz)
79% of 455 reporting companies have beaten estimates by an average of 4% (Timmer)
S&P 500 index maintains upward momentum with broad market participation
Remains in an "uptrend" despite a sharp 10% correction earlier this week
69% of stocks trade above their 200-day moving average, indicating positive momentum (Timmer)
Valuations for the majority of stocks remain reasonable
MegaCap stocks decreased this week (27.6x forward P/E vs. 30.0x in July 26th), while the broader S&P 500 index trades at a more modest 21.4x forward P/E
The Buffett Indicator (total market capitalization to GDP ratio) remains elevated at 186.6%
Historical bull market patterns suggest potential for continued uptrend
Typical bull markets last 30 months with a 90% price gain (Timmer)
The current bull market has lasted 22 months with a 61% peak gain
This historical comparison indicates potential for further growth in the current bull market
Business Cycle
The macroeconomic cycle, particularly changes in growth, inflation, sentiment, and liquidity, is the primary driver of asset market movements. Lets dig in to each of these.
Growth
The US economy shows resilience and economic growth indicators provide a cautiously optimistic outlook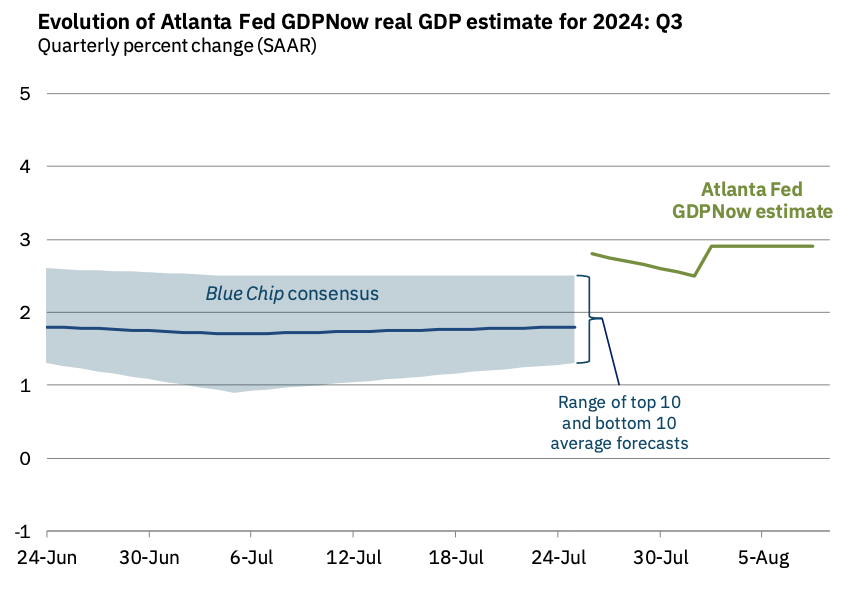
Economic growth indicators provide cautiously optimistic outlook
Atlanta Fed's GDPNow model estimates 2.9% real GDP growth for Q3 2024 (Apollo)
Tax withholdings show no signs of economic slowdown (Apollo)
Business activity metrics suggest continued expansion with some concerns
ISM Services index at 55.5, indicating growth in the services sector (Syz)
Business formation statistics slightly weaker (Apollo)
Weekly and daily data shows robust customer spending
Restaurant bookings and TSA air travel data consistently above or approaching 2019 levels (Apollo)
Credit and debit card spending data shows positive trend compared to January 2020 baseline (Apollo)
11% of credit card balances now 90+ days delinquent, the highest reading since 2012 (Syz). This suggests that current spending levels may not be sustainable.
Retail sales data strong, with positive year-over-year growth (Apollo)
Hotel occupancy rates, daily rates, and RevPAR remain strong (Apollo)
These indicators collectively paint a picture of a resilient economy. Strong consumer spending, robust travel data, and positive retail sales suggest consumer confidence, while the ISM Services index indicates growth in a crucial sector of the economy. However, the rise in credit card delinquencies warrants attention as it may signal financial stress for some consumers.
Inflation
Inflation is moderating overall, with CPI at 2.9% YoY and Core CPI at 3.2% YoY. However, shelter costs remain a concern (index rose 0.4% MoM and 5.1% YoY).

Producer Price Inflation (PPI) data has come in lower than expected. However, PPI may be falling because companies are losing pricing power. This may materialize in compression in profit margins as demand slows.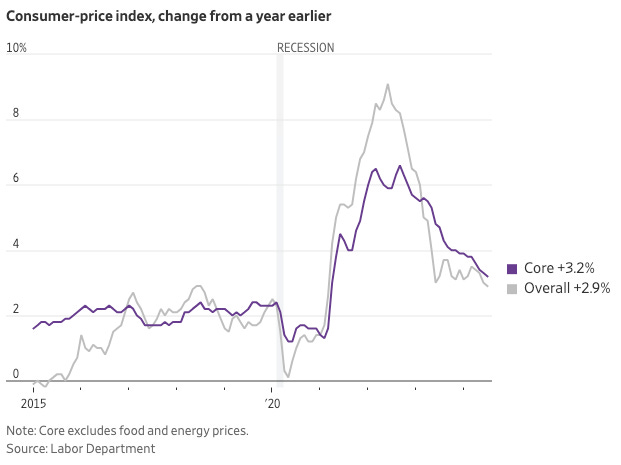
Consumer Price Inflation (CPI)
Consumer Price Inflation (CPI) showing signs of moderation
Housing costs are a significant driver of inflation
The shelter index rose 0.4% in July, accounting for nearly 90% of the monthly increase in the all items index
The shelter index increased 5.1% YoY, accounting for over 70% of the total 12-month increase in the all items less food and energy index
Transportation costs show mixed trends
Motor vehicle insurance index rose 1.2% in July and 18.6% over the past 12 months
Used car prices continue to decline, with the index falling 2.3% in July
Gasoline prices remained unchanged in July (seasonally adjusted) but fell 2.2% over the past 12 months
Airline fares decreased 1.6% in July
Producer Price Inflation (PPI)
Core
Core component of PPI remained unchanged for the month (Nguyen)
Service
The PPI service component dropped 0.2% month-over-month, driven by a significant decline in trade services (1.3% in July—the sharpest decline since 2015). This component represents wholesale and retail margins, serving as a proxy for pricing power of corporates (read: pricing power is going down)
Takeaway
PPI may be falling because companies are losing pricing power. This may materialize in compression in profit margins as demand slows.
Labor
Labor market indicators present a mixed picture: historically high employment rates support consumer spending and S&P 500 earnings while declining job postings and temp staffing suggest caution.

The disappointing July jobs report was likely impacted by weather (Hurricane Beryl in Texas), so we should take it with a grain of salt.
Weather impacts distorted the July jobs report (114,000 jobs were added, far below the predicted 175,000)
1.54 million workers weren't working or working part-time due to weather
Texas, hit by Hurricane Beryl, seemed to produce more layoffs than usual
Indeed job postings
index remains above pre-pandemic levels, but shows slight downward trend (Apollo). This shows evidence of labor hoarding (business keeps more employees than it needs to run its operations)
ASA temp worker staffing index trending lower (Apollo)
Employment-to-population ratio for prime-age workers at highest since 2001 (Goldman Sachs)
These mixed signals in the labor market are confusing. While the high employment-to-population ratio indicates a strong job market, the declining job postings and temp worker indices may signal a potential slowdown. This could indicate that employers are becoming more cautious about hiring, possibly due to economic uncertainties. Furthermore, the disappointing July jobs report was likely impacted by Hurricane Beryl in Texas, so we should take it with a grain of salt.
Sentiment
Sentiment
According to the AAII Investor Sentiment survey, investors were more bearish this week (37.45%). This reading is a significant increase compared to 4 weeks ago (23.4% bearish)
CNN Fear & Greed Index moved from "Extreme Fear" to "Fear" (Syz)
3.3 million S&P 500 Put Options traded Monday, new all-time record (Syz). 0DTE option volumes are shifting towards puts (Syz)
Increased bearish sentiment often indicates investor caution or pessimism, which can lead to market volatility. However, it can also create potential buying opportunities if the underlying economic fundamentals remain strong (we believe so).
Allocation
Not much has changed from an allocation perspective, as investors are still overweight equities (despite slight downward revision this week).
Berkshire Hathaway's actions are closely watched by investors as indicators of market trends. The company's record cash pile and consecutive quarters of net stock selling might suggest caution about current market valuations. However, it's important to note that Berkshire's strategy is long-term oriented and may not necessarily predict short-term market movements.
Berkshire Hathaway's cash pile at record $276.9 billion (Syz)
Berkshire net seller of stocks for seven quarters straight (Syz)
Liquidity
Yen Carry Trade Unwind
The Yen carry trade caused volatility last week (VIX spiked to o 65.7 on Monday). However, JP Morgan estimates that 75% of yen carry trades were unwound this week, and the BoJ Deputy Governor backed off saying that  they won't raise rates when market is unstable.

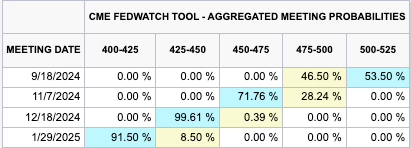
Net result is that liquidity might flow back into the market as 1) inflation comes down and 2) Fed cuts rates in September
A carry trade involves borrowing in a low-interest currency (in this case, the Japanese Yen) to invest in higher-yielding assets elsewhere. This strategy can significantly impact global liquidity and currency markets. The unwinding of these trades can lead to market volatility as large sums of money trade hands.
The yen carry trade caused a 10% correction + volatility last week (detailed here).
The yen carry trade's estimated size is approximately $4 trillion
Hedge funds are able to employ extreme leverage in these trades.
Firms like Citadel can leverage $50 billion in capital into $1 trillion in market exposure using leverage investment banks
Now, JP Morgan estimated 75% of yen carry trades were unwound.
Analysts at TS Lombard, however, said that investors may need to find up to $1.1 trillion to pay off yen carry trade-borrowing.
Fed Rate Cuts
Potential rate cuts by the Federal Reserve could stimulate economic growth by lowering borrowing costs for businesses and consumers. For the stock market, lower rates often lead to higher valuations but may also signal concerns about economic growth.
Futures markets are pricing in 50-basis point rate cut next month, followed by two 25-basis point cuts (Goldman Sachs)
Bibliography:
Apollo Global Management. "Daily and Weekly Indicators for the US Economy." 10 Aug. 2024.
Burgess, Matthew. "JPMorgan Says Three Quarters of Global Carry Trades Now Unwound." Bloomberg, 7 Aug. 2024, www.bloomberg.com/news/articles/2024-08-08/jpmorgan-says-three-quarters-of-global-carry-trades-now-unwound.
Burgess, Matthew, et al. "Carry-Trade Blowup Haunts Markets Rattled by Rapid-Fire Unwind." Bloomberg, 11 Aug. 2024, www.bloomberg.com/news/articles/2024-08-11/carry-trade-blowup-haunts-markets-rattled-by-rapid-fire-unwind.
Goldman Sachs Asset Management. "Fixed Income Musings." 7 Aug. 2024.
Hough, Jack. "Blame the Stock Market Crash on the Weather, Says Ed Yardeni. Seriously." Barron's, 7 Aug. 2024, www.barrons.com/articles/stock-market-crash-jobs-ed-yardeni-b5ceb221.
Nguyen, Tuan Minh. "Producer Price Inflation: Lower than expected with wholesale and retail margin dropping at fastest pace since 2015." LinkedIn, 14 Aug. 2023, www.linkedin.com/posts/tuanminhnguyen92_producer-price-inflation-lower-than-expected-activity-7229118349853515779-lKb9.
Syz Group. "Global Markets Weekly Wrap-Up." 10 Aug. 2024.
Timmer, Jurrien. "Summer Squall? Week of 8/12/24." LinkedIn, 12 Aug. 2024, www.linkedin.com/pulse/summer-squall-week-81224-jurrien-timmer-ngcye/.
The Daily Moat. "Week 32, 2024: The Fortress of Solitude Index Starts Today + Weekly Recap + 9 Stock Picks." 11 Aug. 2024.


